This interactive story map depicts the Chicago metro region. It combines layers of tree canopy cover, surface temperature, flood risk, air quality, vulnerable populations, and operational capacity to enable land managers to identify key challenges facing each community and prioritize efforts to improve canopy cover to address those issues. This map was created to help land managers within the 284 municipalities in the seven-county Chicago region to make equity-informed decisions, and to assist in making the case for investment in the urban forest.
In a nutshell, this resource offers:
- Interactive maps that show tree canopy distribution, regional temperatures in relation to trees, urban flooding, air quality, and vulnerable populations, culminating in a priority area map.
- Actionable advice and other resources for municipalities or citizens to enhance the Chicago region's tree canopy.
How to use this resource:
- As an example of how to make complicated data accessible using free online tools (ArcGIS).
Author: Chicago Regional Trees Initiative
Date published: 2019
Point of contact: Lindsay Darling, GIS and Data Specialist, Morton Arboretum, ledarling@gmail.com
Resource available online here.
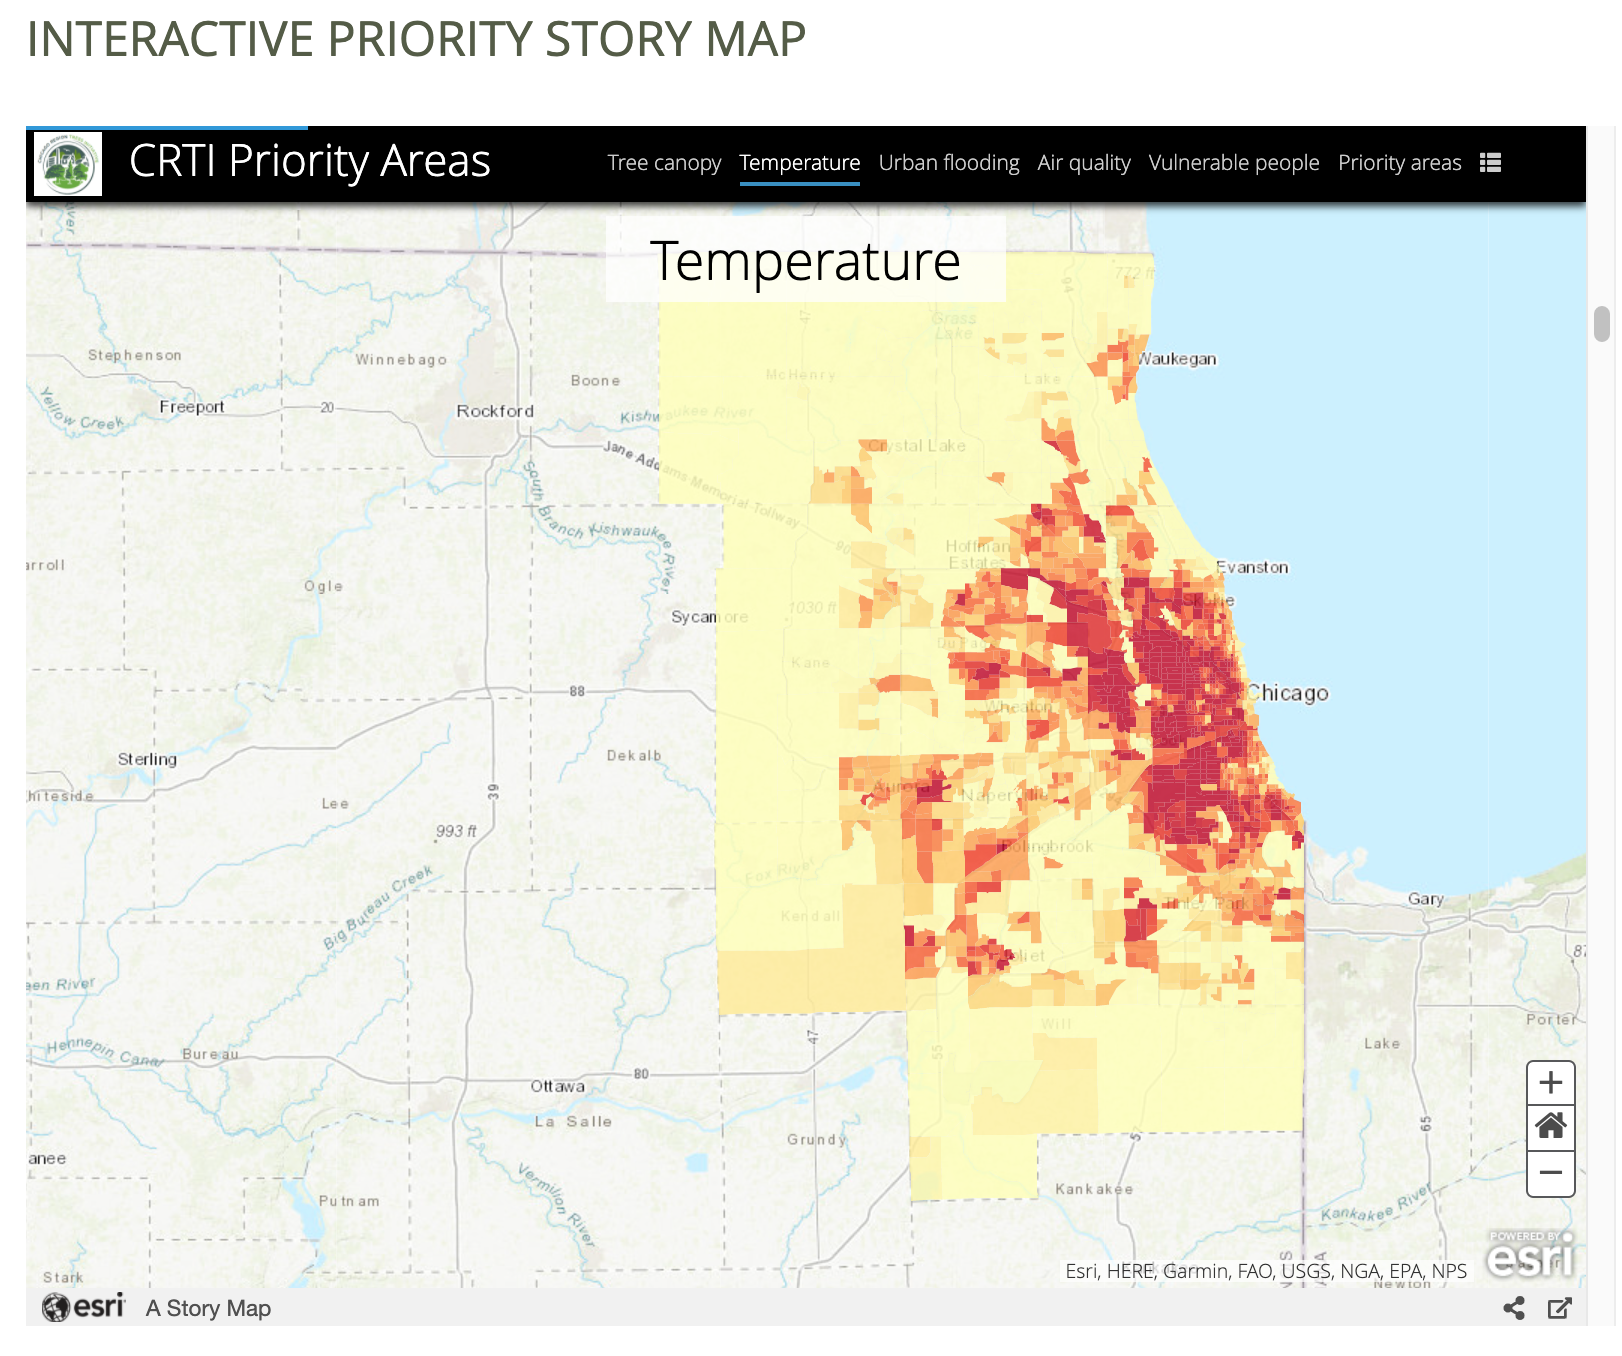 A screen capture of the Chicago Regional Trees Initiative's interactive Priority Map. Click on the image, or the link above, to see the whole map.